December continued the easing trend across wholesale electricity and gas markets, with futures softening across most NEM regions and gas prices declining meaningfully year-on-year. While average pricing moderated, volatility remained a defining feature in select markets, particularly Western Australia, reinforcing the importance of timing, flexibility and risk management as the market transitions into peak summer conditions.
Here is a clear snapshot of the key trends that defined December.
⚡ Electricity Market
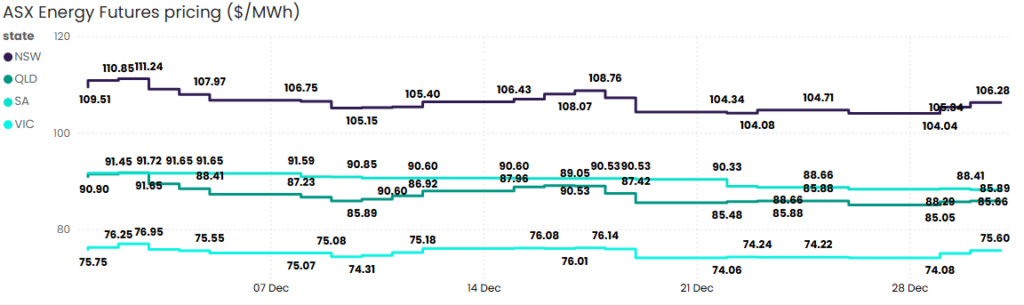
Source: ASX Energy Futures
Electricity futures eased across most regions in December as strong renewable output, relatively contained demand and improved system availability softened forward expectations. While volatility remained elevated in pockets, particularly outside the NEM, the broader market continued to reflect the growing influence of renewables on pricing behaviour.
New South Wales
NSW futures softened 2.9% over the month, declining from $109.50/MWh to $106.28/MWh. Prices traded between $104.04/MWh and $111.24/MWh, reflecting moderate volatility. Solar output remained strong through daylight hours, continuing to suppress daytime pricing and reduce system stress during most demand periods.
Queensland
Queensland recorded the sharpest decline across the eastern states, with futures falling 5.5% to $85.89/MWh. Trading ranged between $85.05/MWh and $91.72/MWh. Strong rooftop solar penetration and regular daytime oversupply continued to weigh on the curve, although short-duration evening peaks remained evident during warmer days.
South Australia
SA futures declined 3.7% to close at $88.22/MWh , trading within a band of $88.22 to $91.65/MWh. Wind output eased from an exceptionally strong 75.9% in November to 70.0% in December, while solar generation increased from 7.0% to 7.8%. Despite the reduction in wind, renewable penetration remained dominant, helping to limit volatility and maintain downward pressure on pricing.
Victoria
VIC futures were largely unchanged, edging down just 0.2% to $75.60/MWh. Prices traded within a relatively tight range of $74.06/MWh to $76.95/MWh, signalling lower volatility than other NEM regions. Consistent renewable output and moderate demand conditions continued to suppress upside risk, even as summer peak exposure begins to increase.
Tasmania
Tasmania remained stable through December, supported by strong hydro availability and softer mainland pricing. Balanced storage levels and steady interconnector conditions helped maintain low volatility, with Tasmanian pricing continuing to track broader NEM softness.
Western Australia
Western Australia once again experienced the most extreme price movements. December saw frequent negative pricing offset by sharp upside events, including multiple spikes to $630/MWh and the $1,000/MWh market cap. While average prices were generally moderate, intermittent supply tightness and peak demand periods reinforced ongoing volatility risk for WA energy users as renewable penetration continues to reshape SWIS dynamics.
New Zealand
New Zealand wholesale electricity prices remained soft through December, supported by strong hydro inflows and high renewable availability. Improved hydro conditions reduced reliance on thermal generation, easing pricing pressure as the market moved into summer. While short-term volatility can still emerge during dry or low-wind periods, overall conditions in December reflected a more balanced supply outlook compared to earlier in the year.
🔥 Gas Market
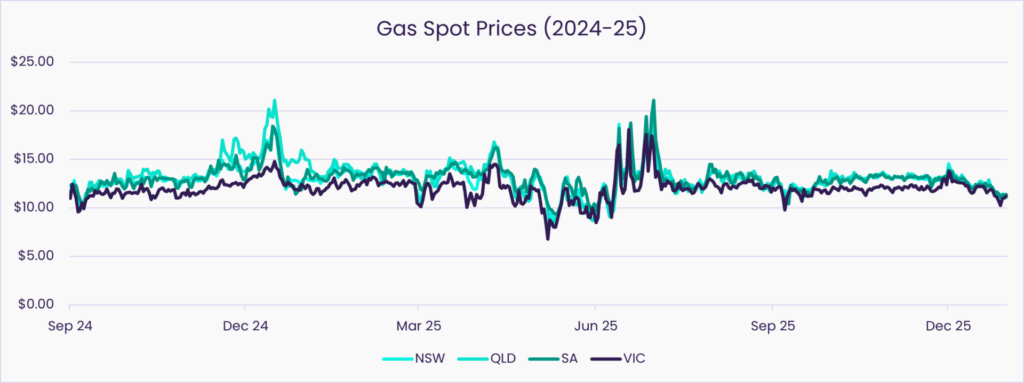
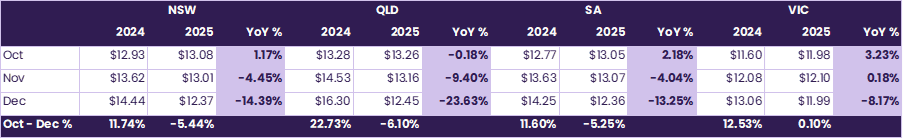
Source: AEMO STTM and DWGM
Gas markets softened across the east coast in December, with all major hubs recording month-on-month declines. Weaker seasonal demand, adequate supply availability and a materially lower LNG netback outlook continued to weigh on pricing.
New South Wales
NSW gas prices continued to ease in December, falling from $13.01/GJ in November to $12.37/GJ, a 5% month-on-month decline. Compared to the same time last year, prices are 14.4% lower, highlighting a significant softening in market conditions. Weaker seasonal demand and improved supply availability have supported a more balanced short-term outlook.
Queensland
QLD prices declined further, easing from $13.16/GJ to $12.45/GJ in December, down 5.4% month-on-month. On a year-on-year basis, prices are 23.6% lower, marking the largest annual correction across the east coast. Strong supply fundamentals and softer demand continue to weigh on pricing, bringing the market closer to long-term averages.
South Australia
SA gas prices softened from $13.07/GJ to $12.36/GJ, a 5.4% month-on-month decline. Prices are now 13.2% lower year-on-year as demand eased into summer and interconnector support remained strong.
Victoria
VIC remained the most stable market, with prices edging down marginally from $12.10/GJ to $11.99/GJ, a 0.9% month-on-month decrease. Year-on-year, prices are 8.2% lower, supported by softer demand and relatively healthy storage levels, which have helped limit volatility compared to other states.
🌏 LNG Netback
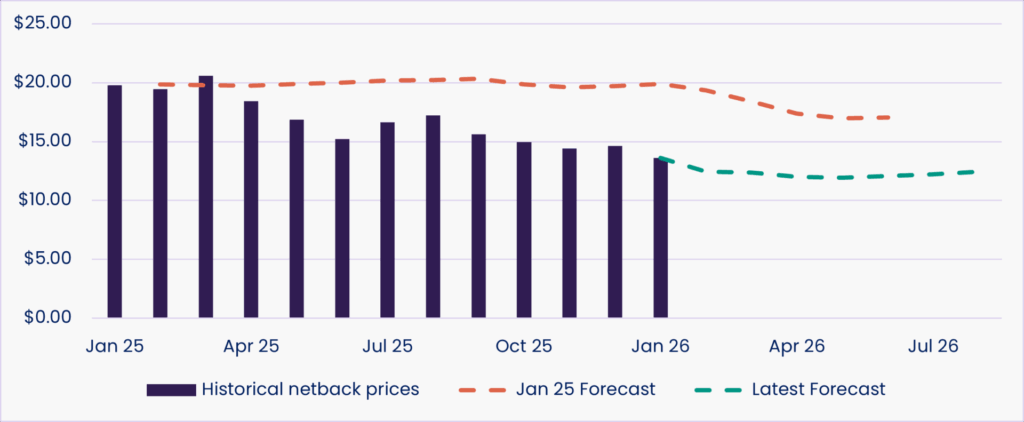
LNG netback prices have materially reset lower, with latest forecasts now closely aligned to historical Netback levels. The January 2026 outlook has fallen to $13.61/GJ, down from early 2025 forecasts near $20/GJ, with prices expected to ease toward $12/GJ through mid-2026. This convergence reflects softer global demand, adequate supply conditions and reduced spot market volatility, easing upward pressure on domestic gas markets.
Capacity Investment Signals Strengthen as 2026–2030 Window Comes into Focus
December commentary increasingly turned to the next investment window, as market participants looked beyond near-term softness toward the late-2020s capacity gap flagged by AEMO. Announcements and approvals across batteries, hybrid projects and firming infrastructure reinforced that while short-term conditions remain comfortable, the medium-term system still requires timely capital deployment. The focus shifted from whether investment is needed to whether it will arrive fast enough.
What does this mean for you?
- Market conditions are currently softer, but risk has not disappeared.
- Understanding your position matters as much as tracking headline prices.
- Decisions made now can influence exposure when conditions change.
Gas Policy and Domestic Supply Remain Under the Microscope
December saw renewed attention on east coast gas policy settings, with ongoing scrutiny of domestic supply adequacy and the role of export-linked pricing. While LNG netbacks softened materially, policy debate continued around reservation, supply transparency and long-term availability. This kept gas firmly in focus as a strategic input, even as prices eased.
What does this mean for you?
• Short-term pricing is improving, but policy remains a non-price risk to monitor.
• Gas continues to play a critical firming role, even as electrification accelerates.
• Gas cost volatility has moderated, but structural exposure remains.
Environmental Markets Quiet, but Strategic Positioning Continues
While December experienced relatively subdued activity across LGC and environmental certificate markets, this was widely viewed as a pause rather than a pivot. Market participants continued to track future supply, compliance demand and policy signals closely, particularly in the context of Safeguard Mechanism obligations and longer-dated PPAs. Environmental exposure remains embedded in contract and strategy decisions, even when not driving headline pricing.
What does this mean for you?
• Environmental costs should remain part of long-term contracting decisions.
• Timing and structure of certificate exposure matters as markets evolve.
• Quieter conditions may present opportunities to review or rebalance positions.
Ready for what’s next?
If you’d like to understand how current market conditions relate to your contracts or portfolio, Utilizer can help. Reach out to our expert team for clear, practical guidance that supports better energy decisons.
More power to you.
Recent Blogs
Heatwaves and the Energy Market
January 13, 2026 | Read the Blog
Empower Your Business with Our Expert Energy Consulting Services
December 19, 2025 | Read the Blog
Energy Analytics are the Key to Better Utilities Management in Australia
December 19, 2025 | Read the Blog
Safeguard Mechanism 2024–25: Rising Carbon Pressure and What It Means for Large Energy Users
December 9, 2025 | Read the Blog
AEMO’s 2025 System Security Plan: Key Insights for Large Energy Users
December 1, 2025 | Read the Blog