Electricity and gas markets eased across much of Australia in January, with futures prices declining in all National Electricity Market (NEM) states and gas prices continuing their downward trend after a relatively balanced summer period. While headline prices softened, underlying signals across supply, demand and generation mix reinforce why timing and structure remain critical in energy procurement decisions.
Below, we break down the key movements across electricity and gas markets in January and what they may mean for businesses planning ahead.
⚡ Electricity Market
January saw a broad easing in electricity futures prices across the NEM, supported by improved supply conditions, strong renewable output and reduced near-term reliability concerns in several regions.
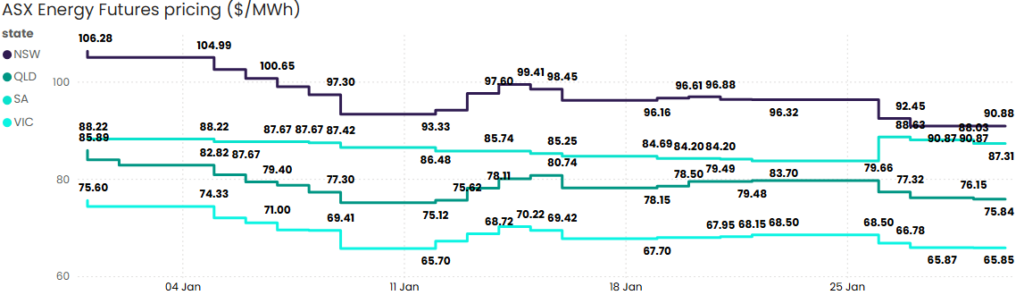
Source: ASX Energy Futures
New South Wales
NSW futures declined 14.5% over the month, closing at $90.88/MWh after opening at $106.33/MWh. Prices trended lower throughout January, with the close aligning closely to the monthly low.
A key development influencing sentiment was Origin Energy’s confirmation that Eraring Power Station will remain operational until April 2029, extending the life of approximately 2,880 MW of coal-fired capacity. This extension materially reduces near-term reliability risk in NSW and has helped moderate upside price pressure by improving supply adequacy through the second half of the decade.
Queensland
Queensland futures softened 11.7%, closing January at $75.84/MWh after opening at $85.89/MWh. While prices eased, trading ranges remained relatively narrow, indicating a controlled adjustment rather than heightened volatility.
Renewable generation continued to support market balance. Solar contribution lifted slightly from 14.2% to 14.4%, while wind output increased from 9.1% to 9.4%, helping to moderate price outcomes.
South Australia
South Australia remained the most stable market across the NEM. Futures edged down just 1.0%, closing at $87.31/MWh, with prices trading within a tight range between $83.70/MWh and $88.63/MWh.
High renewable penetration and strong interconnection support continued to underpin price stability, limiting volatility despite broader movements in other regions.
Victoria
Victoria futures fell 12.9% across January, closing at $65.85/MWh after opening at $75.60/MWh. The decline was relatively steady rather than abrupt, with prices remaining within a contained trading band.
Notably, Victoria recorded a new all-time electricity demand peak, with market demand exceeding 10,500 MW on 27 January during extreme heat conditions. While this drove short-lived spot price spikes during evening peaks, futures pricing remained anchored, highlighting the distinction between short-term operational stress and longer-term market expectations.
Western Australia
Western Australia experienced pronounced volatility through January. Daily average prices ranged from $29.69/MWh to $167.68/MWh, with volatility re-emerging late in the month. On 21 January, prices reached the $1,000/MWh market cap, reflecting tight supply conditions in the SWIS.
This reinforces the importance of jurisdiction-specific risk assessment for WA-based businesses, given the distinct dynamics of the market.
🔥 Gas Market
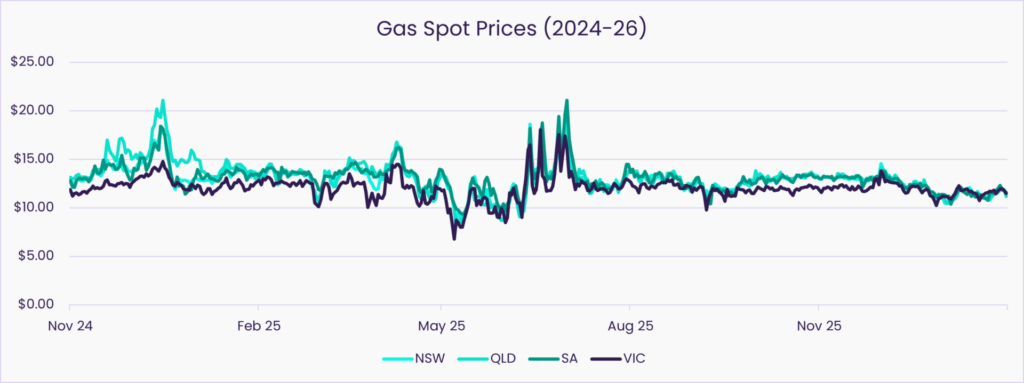
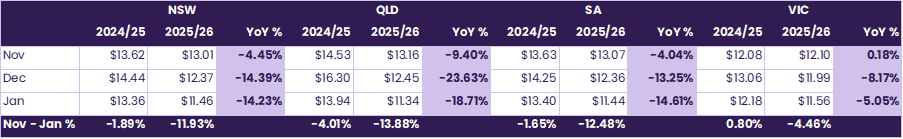
East coast gas markets continued to soften through the November–January period, with all major states recording year-on-year price declines. Improved supply conditions and relatively subdued seasonal demand contributed to the easing trend.
Source: AEMO STTM and DWGM
New South Wales
NSW gas prices averaged $11.45/GJ in January, down 14.2% year-on-year. While November pricing was relatively stable, softer outcomes in December and January drove an overall 11.9% decline across the Nov–Jan period.
Queensland
Queensland recorded the largest year-on-year decline, with January prices falling 18.7% to $11.34/GJ. Weakening was consistent across all three months, resulting in a 13.9% drop over the Nov–Jan window, reflecting ample supply and subdued demand.
South Australia
South Australian prices also eased materially, with January down 14.6% year-on-year to $11.44/GJ. Declines across December and January drove a 12.5% reduction over the Nov–Jan period, aligning SA closely with broader east coast trends.
Victoria
Victoria remained the most resilient gas market. While November prices were marginally higher year-on-year, December and January softness brought January prices to $11.58/GJ, down 5.1% YoY. Overall, Victoria recorded the smallest decline across the eastern states.
🌏 LNG Netback
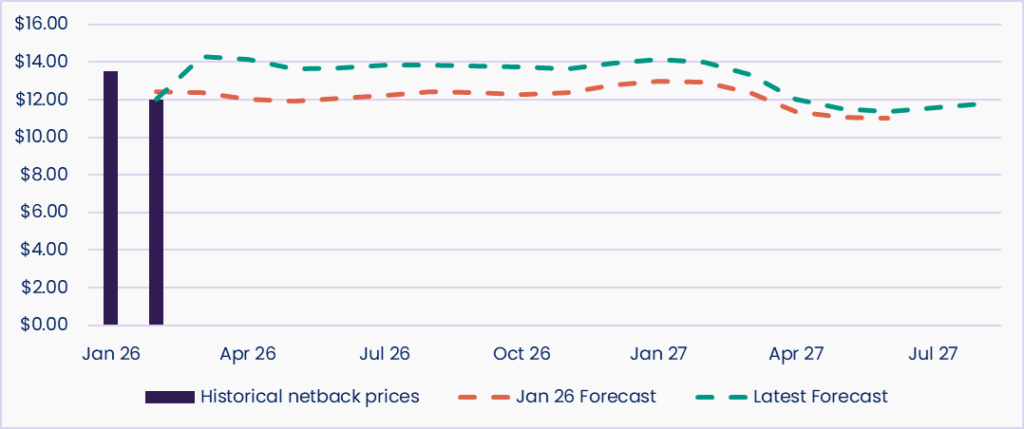
LNG netback prices remain elevated across the forward curve, with recent forecasts revised higher compared to earlier expectations. The February 2026 netback forecast of $12.45/GJ now sits above the historical netback of $12.00/GJ, reflecting stronger seasonal demand assumptions and tighter forward supply expectations.
Forecasts through mid-2026 remain in the $13.66–$13.86/GJ range, reinforcing the role netback pricing continues to play in shaping domestic gas contract negotiations, despite recent spot price softness.
👀What We’re Watching
Extreme Heat Events Are Becoming a Core Planning Risk
Australian Energy Market Operator (AEMO) has continued to highlight the impact of extreme heat on late-afternoon and evening demand peaks during the current summer period — particularly as solar output declines and the system relies more heavily on firming capacity.
What we’re watching is not just the demand records themselves, but how the system responds. So far, peak events have resulted in short-lived spot price spikes rather than sustained reliability disruptions, reflecting the growing contribution of batteries, interconnection support and fast-start generation.
However, if heat intensity or duration increases beyond forecast assumptions, or if coincident outages occur during peak periods, volatility could escalate quickly. How these events play out over the remainder of summer will provide a clearer signal on whether firming capacity and demand response are scaling fast enough to manage increasingly frequent stress conditions.
East Coast Gas Supply Tightness Still Looms Beyond 2026
The Australian Competition and Consumer Commission (ACCC) has reiterated that while near term gas market conditions have eased, structural supply risks remain beyond the mid 2020s as southern basin production declines and LNG export demand continues to influence domestic pricing.
What we are watching here is the gap between current spot softness and forward supply signals. While prices have moderated over summer, forward LNG netback curves and declining southern production suggest tightening conditions later in the decade.
If new supply projects are delayed, or if international LNG demand strengthens unexpectedly, domestic pricing could reprice quickly. The next 12 to 24 months will be critical in determining whether structural shortfall risks are mitigated or whether forward contract markets begin pricing in greater scarcity.
Investment Focus Shifts Toward Firming and Storage
Across the NEM, investment signals continue to shift toward batteries, flexible generation and network upgrades, reflecting the need to manage peak timing and system variability rather than simply expanding renewable capacity.
What we are watching is the pace and scale of firming capacity entering the market relative to coal retirements and rising demand volatility. Battery build out is accelerating, but the question is whether deployment timelines align with system stress periods, particularly during extreme weather events.
If firming capacity scales in line with transition milestones, volatility should remain manageable. If not, short duration price spikes may become more frequent, influencing contract structure, hedging appetite and procurement timing decisions.

Frequently Asked Questions
How do electricity futures prices affect business energy contracts?
Electricity futures prices influence the rates retailers offer for fixed and structured contracts. Movements in futures markets help signal pricing direction and risk, which is why monitoring trends can be useful when planning procurement timing and contract structure.
Why can electricity prices still spike even when markets appear stable?
Short-term price spikes can occur due to extreme weather, demand peaks, generator outages, or network constraints. These events highlight system stress and can affect spot exposure and how retailers price risk into contracts, even when average market conditions appear stable.
Why are gas prices easing now but expected to tighten later?
Gas prices can soften in the short term due to milder weather and stable supply. Longer-term pressures such as declining domestic production, LNG export demand, and forward netback pricing can tighten supply, influencing future contract pricing and availability.
What is LNG netback pricing and why does it matter for Australian businesses?
LNG netback pricing reflects the value of exporting gas overseas after accounting for liquefaction and transport costs. It acts as a benchmark for domestic gas pricing on the east coast and influences how competitive local gas supply is compared to export markets.