November delivered broad softening across wholesale electricity futures, with every mainland NEM state recording declines. Renewable generation continued to shape daytime conditions, while mild temperatures kept demand contained. Gas prices were largely stable across the east coast, supported by steady supply, balanced storage and a subdued LNG netback outlook.
Here is a clear snapshot of the key trends that defined November.
⚡ Electricity Market
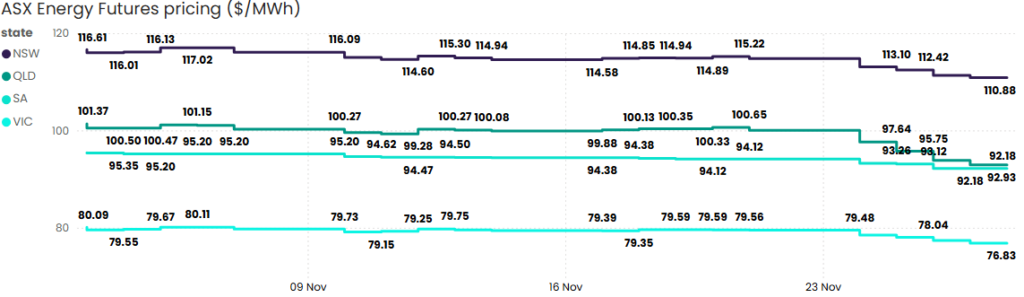
Source: ASX Energy Futures
Electricity futures weakened across the NEM in November as stronger renewable penetration, moderate temperatures and subdued demand drove softer forward expectations. South Australia remained the most renewables-heavy state, while Western Australia continued to experience extreme volatility across the month.
New South Wales
NSW futures fell 4.9%, declining from $116.61/MWh to $110.88/MWh. Trading ranged between $110.88/MWh and $117.02/MWh, reflecting moderate volatility. Solar generation rose from 16.7% to 18.7%, while wind output remained stable. Both helped soften grid pressure during a month of relatively subdued market demand.
Queensland
Queensland recorded the largest fall across the NEM, with futures down 8.3% to $92.93/MWh. Prices traded between $92.93/MWh and $101.37/MWh. Strong rooftop solar and regular daytime oversupply continued to dampen the curve, although short evening peaks remained a feature on hotter days. Queensland’s spring pattern of stability is still intact, despite the sharper month-on-month drop.
South Australia
SA futures slipped 3.4%, closing at $92.18/MWh after opening at $95.44/MWh. The state exhibited the lowest volatility across the month, with the narrowest trading range of all regions. Solar rose modestly from 6.9% to 7.0%, but the standout was a surge in wind generation from 64.6% to 75.9%. The heavy wind contribution reinforced SA’s position as the most renewables-driven market in the NEM and supported consistent downward pressure on futures.
Victoria
VIC futures fell 4.1%, closing November at $76.83/MWh. Trading ranged between $76.83/MWh and $80.11/MWh. While Victoria remains more volatile than the northern states, steady wind output and strong rooftop solar kept upward pressure limited. The forward curve continues to reflect the influence of renewables, even as summer peak risk slowly begins to build.
Tasmania
Tasmanian regulated wholesale prices remained steady across October and November. CAL26 opened at $82.03/MWh and traded within a narrow band before finishing near $80.35/MWh in early December. A brief peak to $82.99/MWh in late October did little to shift the overall trend. Balanced hydro storage and stable interconnector conditions helped maintain low volatility.
Western Australia
WA experienced the widest range of pricing conditions across the country. Electricity prices swung from early-month highs above $119/MWh to extended periods below $50/MWh in mid-November, driven by strong renewable output and mild temperatures. Several days saw prices dip under $20/MWh. The volatility reflects the rapid growth of rooftop and utility-scale solar within the SWIS, which is increasingly shaping system behaviour.
🔥 Gas Market
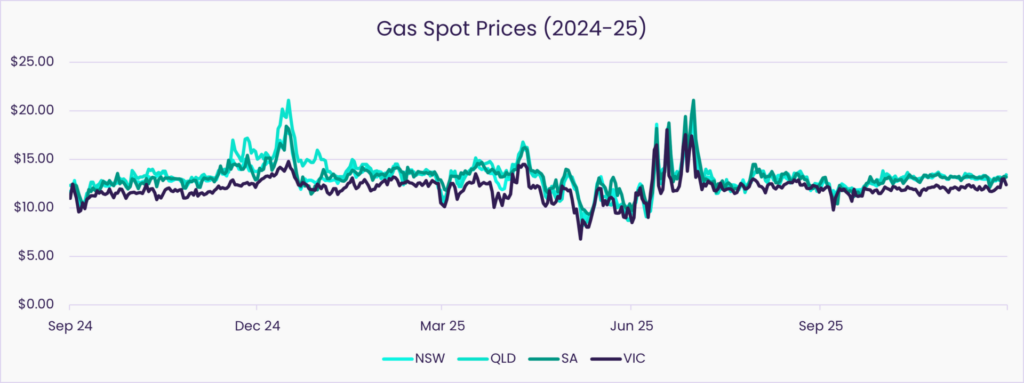
Source: AEMO STTM and DWGM
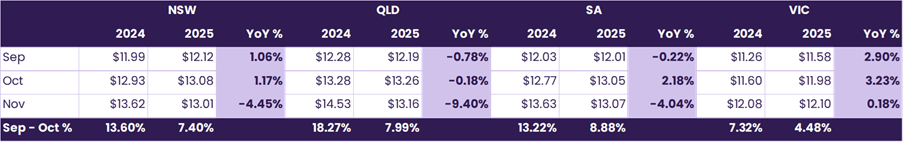
Gas prices held relatively stable across the NEM, with only modest month-on-month movements. Supply availability, moderated demand and softer LNG indicators continued to support pricing in the low-to-mid teens.
New South Wales
NSW gas prices eased slightly from $13.08/GJ to $13.01/GJ, a 0.5% month-on-month decrease. Year-on-year, prices are 4.45% lower, reflecting easing seasonal demand and stable supply conditions after October’s uplift. NSW continues to show balanced fundamentals with no major disruptions across the east coast network.
Queensland
Queensland gas declined from $13.26/GJ to $13.16/GJ, down 0.8% month-on-month and 9.40% year-on-year. Ample supply and softer LNG export influence kept Queensland the most stable east coast market. Trading conditions remained consistent with long-term patterns.
South Australia
SA gas prices were effectively flat, moving from $13.05/GJ to $13.07/GJ. The state saw a 4.04% year-on-year decline, reflecting strong interconnector support and stable demand. SA remains well-supplied entering summer, with balanced trading conditions.
Victoria
Victoria saw a slight lift from $11.98/GJ to $12.10/GJ, up 1% month-on-month. Year-on-year, prices rose by only 0.18%, indicating stability despite a structurally tighter southern market. Softer spring demand and adequate storage helped contain volatility.
LNG Netback
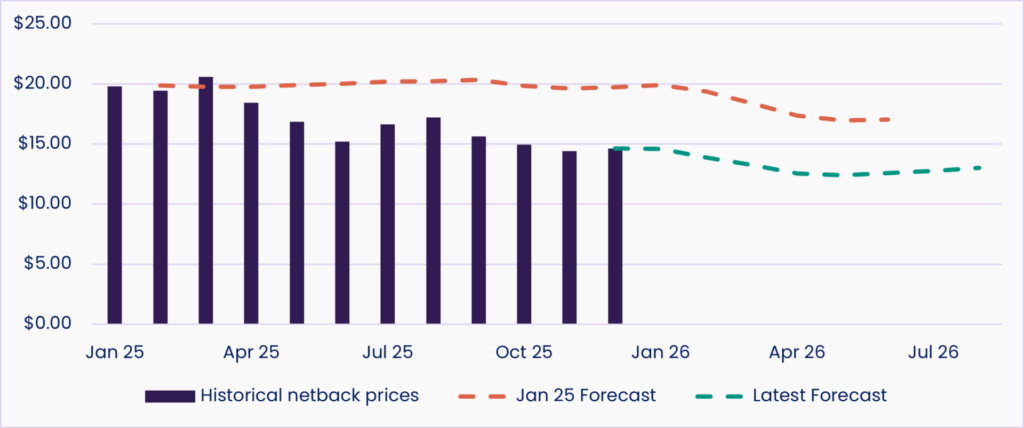
LNG netback prices continued to ease across the forward curve, with the latest forecasts trending materially below earlier expectations. The Jan-25 forecast of $19.62/GJ now compares with a spot netback of $14.42/GJ, marking a significant downward adjustment driven by softer Asian demand and healthy global LNG supply. The curve remains consistently subdued through mid-2026, with latest expectations around $12.41–$12.58/GJ for Apr–Jun 2026 delivery. The revised LNG outlook reflects a softer international price environment, reduced spot market volatility, and strong supply availability.
Record Wind and Solar Continue to Reshape Pricing
Renewables again played a dominant role in shaping market outcomes during November. South Australia’s wind generation surged to more than 75% of supply, while rooftop solar lifted across NSW and Queensland. Several regions experienced extended periods of low or negative daytime pricing, reinforcing how quickly the generation stack is evolving.
What does this mean for you?
• For industrial users: opportunities exist to align processes with low-cost daytime windows.
• For procurement teams: load shape variation is becoming an increasingly important contract consideration.
• For corporates: renewable timing and curtailment risk continue to influence PPA performance and net zero pathways.
WA Volatility Highlights System Change Across the SWIS
Western Australia’s sharp November swings highlighted how rapidly the SWIS is responding to growing variable renewable energy. Extended periods below $20/MWh were recorded in the middle of the month, reflecting oversupply conditions. While WA is not part of the NEM, the trend mirrors the broader national shift toward deeper renewable penetration.
What does this mean for you?
• For large users with WA operations: greater volatility may offer new optimisation or hedging opportunities.
• For energy users in the rest of the country: the pace of change in WA provides a preview of future conditions in other regions.
LNG Outlook Signals Softer Pricing Ahead
The sustained decline in LNG netback expectations is a key feature of forward gas markets. Softer global demand and ample supply have driven ongoing revisions to the curve, reducing upward pressure on domestic prices heading into 2026.
What does this mean for you?
• For procurement teams: reduced LNG pressure improves forward visibility for contracting decisions.
• For CFOs and budget owners: gas cost uncertainty is moderating compared with earlier in the year.
If you’d like to understand how these trends relate to your business, your contracting position or your broader energy strategy for 2026 and beyond, Utilizer is here to help. Our team monitors these movements daily so you can navigate the market with clarity and confidence, backed by data and practical guidance.
Reach out to our energy experts if you’d like to discuss your portfolio, explore optimisation opportunities or prepare for upcoming renewal windows.
More power to you.
Recent Blogs
Safeguard Mechanism 2024–25: Rising Carbon Pressure and What It Means for Large Energy Users
December 9, 2025 | Read the Blog
AEMO’s 2025 System Security Plan: Key Insights for Large Energy Users
December 1, 2025 | Read the Blog
Australia’s Carbon Market: What Matters for C&I Energy Strategy in 2026
November 28, 2025 | Read the Blog
Energy Consultants: How the Best Reduce Risk for Your Business
November 28, 2025 | Read the Blog